
11 KiB
page-type:: TEACHING/SE4IOT
-
Slides
-
Da slide 15 di Bononi e Felice - IoT Sensor Data Processing 1.pdf
-
Installation 1.x
According to Downloads (influxdata.com)
sudo apt-get install influxdb sudo service influxdb start -
Play with 1.x (on WSL)
influx // this will start the client
show databases
create database myfirstdatabase
use myfirstdatabase
show measurements
We get empty measurements. They are typically collected by agents like Telegraf,etc.
We can manually insert measurements as follows:
insert cpu,host=node1 value=10Now we can show the recently added measurement with
show measurementsWe can get the content of the cpu measurement as follows
select * from cpuWe can drop measurements with the following command
drop measurement cpuLet's insert some measurements:
insert cpu,host=node1 value=10
insert cpu,host=node2 value=15
insert cpu,host=node3 value=22
Now we can do again
select * from cpuWe can see all the series as follows:
show seriesWe can do some filtering as follows:
select * from cpu where host='node2'We can also do filtering based on time, e.g. I want to retrieve the data related to the last 5 minutes
select * from cpu where time >= now() - 5mselect * from cpu where time >= now() - 5m and host='node3'And what happens if I do as follows?
select * from cpu where time >= now() - 1m -
Installation 2.x
-
Remember to stop influxdb 1.x
-
sudo service influxdb stop -
wget https://dl.influxdata.com/influxdb/releases/influxdb2\_2.0.3\_amd64.deb
sudo dpkg -i influxdb2\_2.0.3\_amd64.deb
influxdb
The web dashboard is available at localhost:8086
-
Play with 2.x (in [docker]
-
First of all you have to install it according to Install InfluxDB | InfluxDB OSS v2 Documentation (influxdata.com) and run it
-
docker run --name influxdb -p 8086:8086 influxdb:2.7.4 -

-
5LW7B-5ySei2kPoLtPIwBFS0KfK-uAcnxYE04BoJhalwdzQjvRz5zi7bELcTNw_WDkfCUkJiDd-wvIIDvnYHjQ==
-
Set up a configuration profile [NOT NEEDED HERE]
influx config create -n default \
-u http://localhost:8086 \
-o univaq \
-t 5LW7B-5ySei2kPoLtPIwBFS0KfK-uAcnxYE04BoJhalwdzQjvRz5zi7bELcTNw_WDkfCUkJiDd-wvIIDvnYHjQ== \
-a
The token given above needs to be retrieved from Tokens | Load Data | -- | InfluxDB
To list the created configuration (from within the docker container)
influx config listThe bucket given above is selected from Buckets | Load Data | -- | InfluxDB
Insert measaurements via NodeRed from MQTT Publish to
/nodered/powerconsumption{ "device":"device1", "host":"NodeRed", "power":"373i" } -
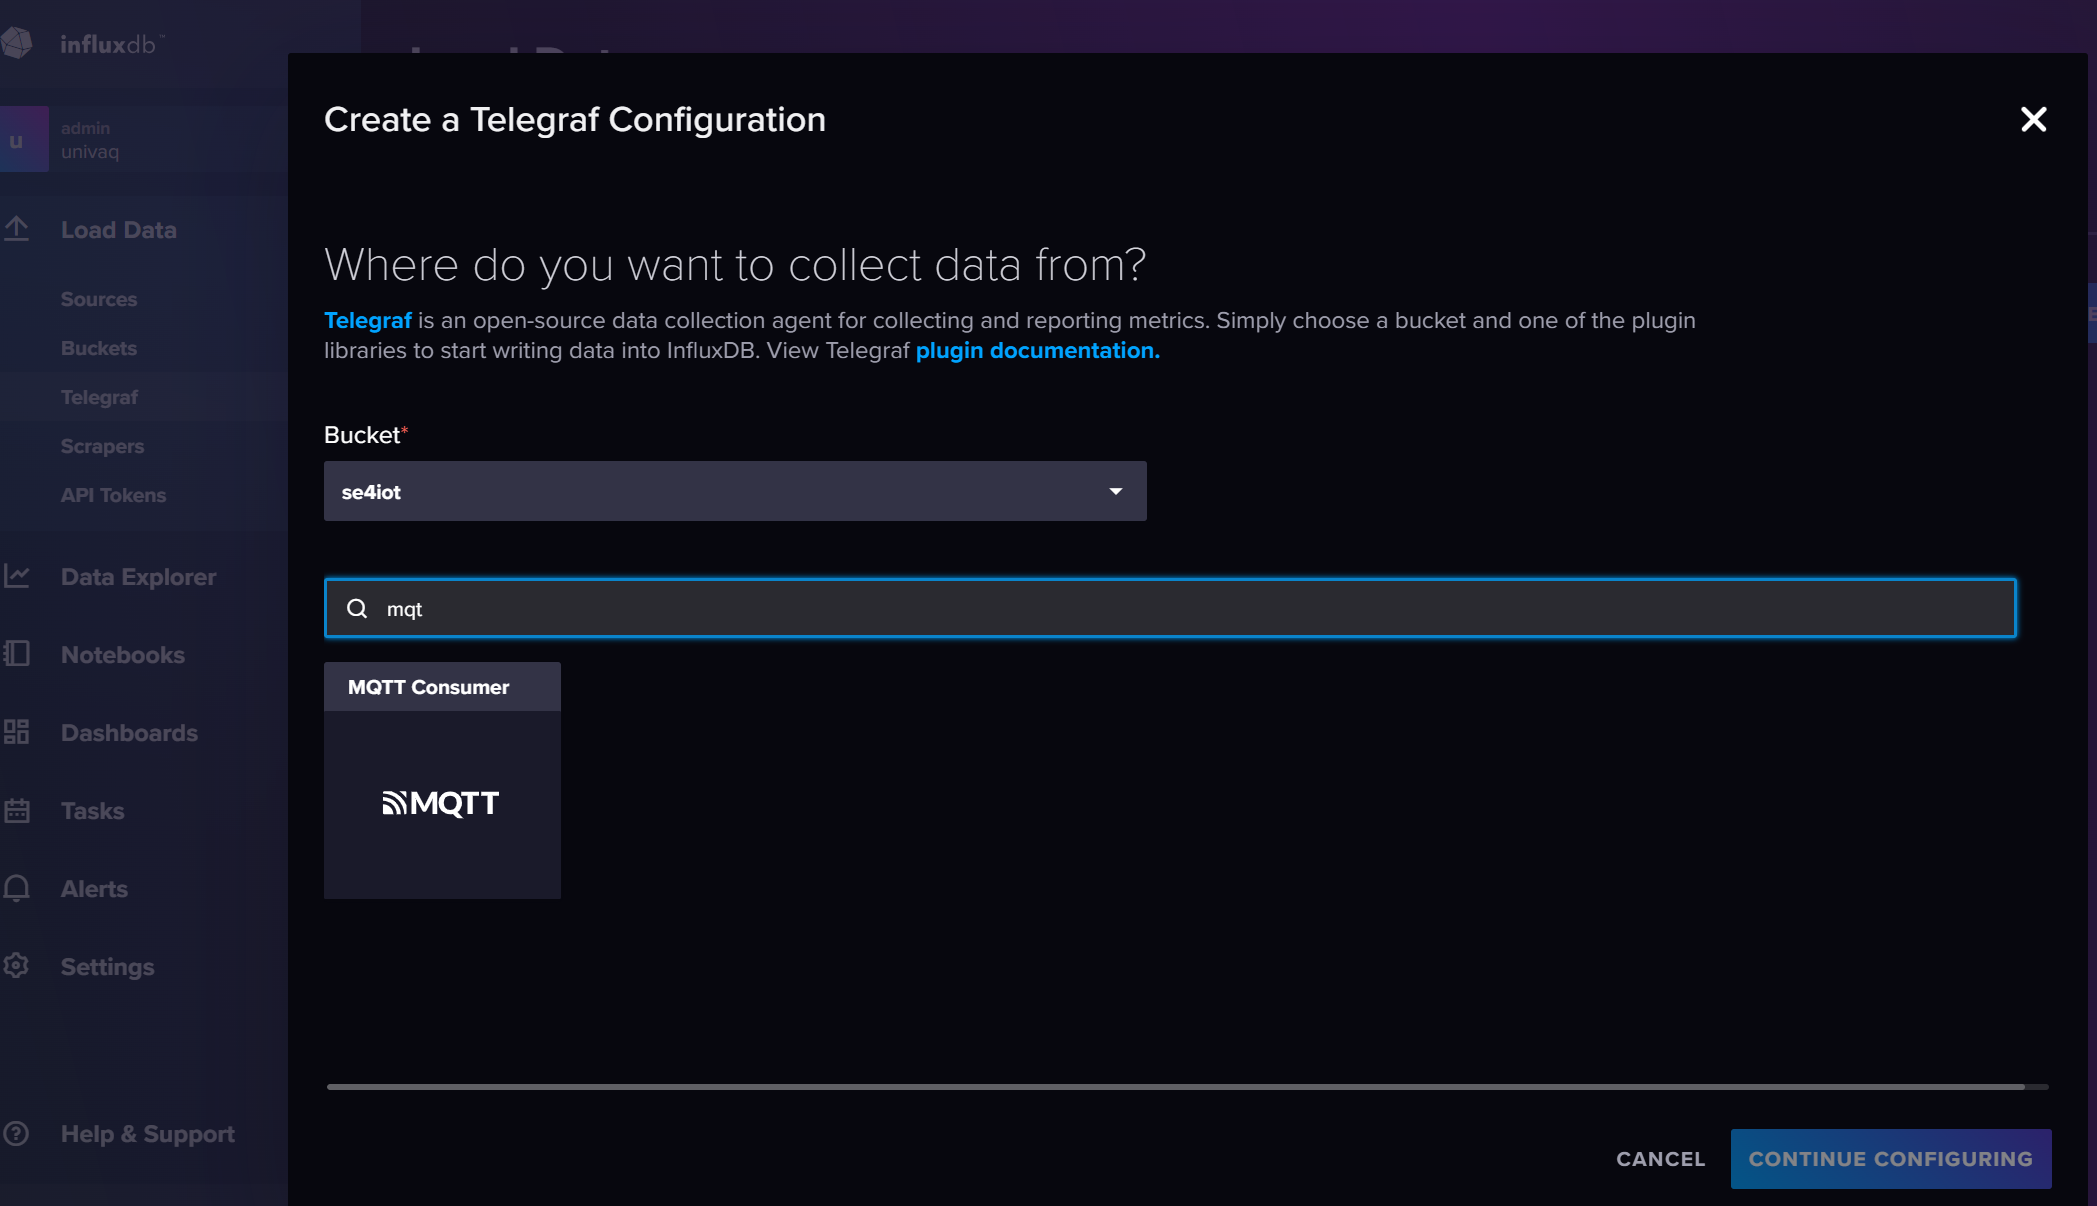
Insert measurements via Telegraf from MQTT
Install Telegraf | Telegraf Documentation (influxdata.com)
# influxdata-archive_compat.key GPG Fingerprint: 9D539D90D3328DC7D6C8D3B9D8FF8E1F7DF8B07E wget -q https://repos.influxdata.com/influxdata-archive_compat.key echo '393e8779c89ac8d958f81f942f9ad7fb82a25e133faddaf92e15b16e6ac9ce4c influxdata-archive_compat.key' | sha256sum -c && cat influxdata-archive_compat.key | gpg --dearmor | sudo tee /etc/apt/trusted.gpg.d/influxdata-archive_compat.gpg > /dev/null echo 'deb [signed-by=/etc/apt/trusted.gpg.d/influxdata-archive_compat.gpg] https://repos.influxdata.com/debian stable main' | sudo tee /etc/apt/sources.list.d/influxdata.list sudo apt-get update && sudo apt-get install telegraf -
-
Telegraf Token
export INFLUX_TOKEN=YQ9t9PhYSeA6Ug0i44BInA-53gYAvq6hwa4_fVPI7MrXhUOugIFMl_o0_ib5Ulhr80-nFVtOmvr-QZWZtxt--Q== -
Run the Telegraf agent
telegraf --config http://localhost:8086/api/v2/telegrafs/0e03dad63d8aa000 -
Publish this to the topic
sensors/powerconsumptionpowerconsumption,device=device2,host=MyHost power=375iThere will be a Telegraf agent that will take such data and sends it to InfluxDB. To this end, Telegraf should be started (even on WSL) by using the following configuration file telegraf_mqtt_to_influxdb2
[[outputs.influxdb_v2]]
## The URLs of the InfluxDB cluster nodes.
##
## Multiple URLs can be specified for a single cluster, only ONE of the
## urls will be written to each interval.
## urls exp: http://127.0.0.1:8086
urls = ["http://localhost:8086"]

## Token for authentication.
token = "WdpITesY4yOqb0dBy7n2WQgWSHPRP66O9mAzlEn7vjYBaCrnn7-bJEiKU5M0XqnU4Amf6So1XunJKKfyt9KGAA=="

## Organization is the name of the organization you wish to write to; must exist.
organization = "univaq"

## Destination bucket to write into.
bucket = "se4iot"

[[inputs.mqtt_consumer]]
## Broker URLs for the MQTT server or cluster.  To connect to multiple
## clusters or standalone servers, use a seperate plugin instance.
##   example: servers = ["tcp://localhost:1883"]
##            servers = ["ssl://localhost:1883"]
##            servers = ["ws://localhost:1883"]
servers = ["tcp://127.0.0.1:1883"]

## Topics that will be subscribed to.
topics = [
  "sensors/#",
]

## The message topic will be stored in a tag specified by this value.  If set
## to the empty string no topic tag will be created.
# topic_tag = "topic"

## QoS policy for messages
##   0 = at most once
##   1 = at least once
##   2 = exactly once
##
## When using a QoS of 1 or 2, you should enable persistent_session to allow
## resuming unacknowledged messages.
# qos = 0

## Connection timeout for initial connection in seconds
# connection_timeout = "30s"

## Maximum messages to read from the broker that have not been written by an
## output.  For best throughput set based on the number of metrics within
## each message and the size of the output's metric_batch_size.
##
## For example, if each message from the queue contains 10 metrics and the
## output metric_batch_size is 1000, setting this to 100 will ensure that a
## full batch is collected and the write is triggered immediately without
## waiting until the next flush_interval.
# max_undelivered_messages = 1000

## Persistent session disables clearing of the client session on connection.
## In order for this option to work you must also set client_id to identify
## the client.  To receive messages that arrived while the client is offline,
## also set the qos option to 1 or 2 and don't forget to also set the QoS when
## publishing.
# persistent_session = false

## If unset, a random client ID will be generated.
# client_id = ""

## Username and password to connect MQTT server.
# username = "telegraf"
# password = "metricsmetricsmetricsmetrics"

## Optional TLS Config
# tls_ca = "/etc/telegraf/ca.pem"
# tls_cert = "/etc/telegraf/cert.pem"
# tls_key = "/etc/telegraf/key.pem"
## Use TLS but skip chain & host verification
# insecure_skip_verify = false

## Data format to consume.
## Each data format has its own unique set of configuration options, read
## more about them here:
## https://github.com/influxdata/telegraf/blob/master/docs/DATA_FORMATS_INPUT.md
data_format = "influx"
Similar things can be done via command line as follows
export INFLUX_TOKEN=Ga8nVsXP4FAe5_M1a5j7uCa4zO_u_M9oUsO8wUSWh_wPbR3clc9ZTv420Li9adOVCPl1tGvn6hLHfI5gP7Lm5A== influx write -b se4iot -o univaq -p s 'powerconsumption,device=device2,host=CommandLine power=675i'- sensors/powerconsumption
-
Insert measurements via Java
package it.univaq.disim.se4iot.influxdbexample;

import java.time.Instant;

import com.influxdb.annotations.Column;
import com.influxdb.annotations.Measurement;
import com.influxdb.client.InfluxDBClient;
import com.influxdb.client.InfluxDBClientFactory;
import com.influxdb.client.WriteApi;
import com.influxdb.client.domain.WritePrecision;
import com.influxdb.client.write.Point;
import com.influxdb.query.FluxTable;

public class InfluxDB2Example {


public static void main(final String[] args) {

 // You can generate a Token from the "Tokens Tab" in the UI
 String token = "5LW7B-5ySei2kPoLtPIwBFS0KfK-uAcnxYE04BoJhalwdzQjvRz5zi7bELcTNw_WDkfCUkJiDd-wvIIDvnYHjQ==";
 String bucket = "se4iot";
 String org = "univaq";

 InfluxDBClient client = InfluxDBClientFactory.create("http://localhost:8086", token.toCharArray());

Point point = Point
 .measurement("powerconsumption")
 .addTag("device", "device3")
 .addField("power", 300)
 .time(Instant.now(), WritePrecision.NS);

try (WriteApi writeApi = client.getWriteApi()) {
 writeApi.writePoint(bucket, org, point);
}

}
}
In a dedicated Maven project with the following pom.xml
<project xmlns="http://maven.apache.org/POM/4.0.0" xmlns:xsi="http://www.w3.org/2001/XMLSchema-instance" xsi:schemaLocation="http://maven.apache.org/POM/4.0.0 https://maven.apache.org/xsd/maven-4.0.0.xsd"> <modelVersion>4.0.0</modelVersion> <groupId>it.univaq.disim.se4iot.influxdbexample</groupId> <artifactId>it.univaq.disim.se4iot.influxdbexample</artifactId> <version>0.0.1-SNAPSHOT</version> <dependencies> <dependency> <groupId>com.influxdb</groupId> <artifactId>influxdb-client-java</artifactId> <version>1.8.0</version> </dependency> </dependencies> <build> <sourceDirectory>src</sourceDirectory> <plugins> <plugin> <artifactId>maven-compiler-plugin</artifactId> <version>3.8.0</version> <configuration> <release>12</release> </configuration> </plugin> </plugins> </build> </project> -
Some tutorials
(14) InfluxDB Tutorial - Complete Guide to getting started with InfluxDB - YouTube (14) Introduction to InfluxDB 2 & Flux | Rawkode Live - YouTube (14) Node-Red: inseriamo dati su InfluxDB - YouTube
-
To remove all the data from the simple bucket
-
influx delete --bucket se4iot --org univaq --start 1970-01-01T00:00:00Z --stop 2100-01-01T00:00:00Z

